Now that you know about choosing tools to assist with gathering social media data (if you decide to choose one), there’s basically a three step process in achieving social media analytics. These steps are Capture, Understand and Present.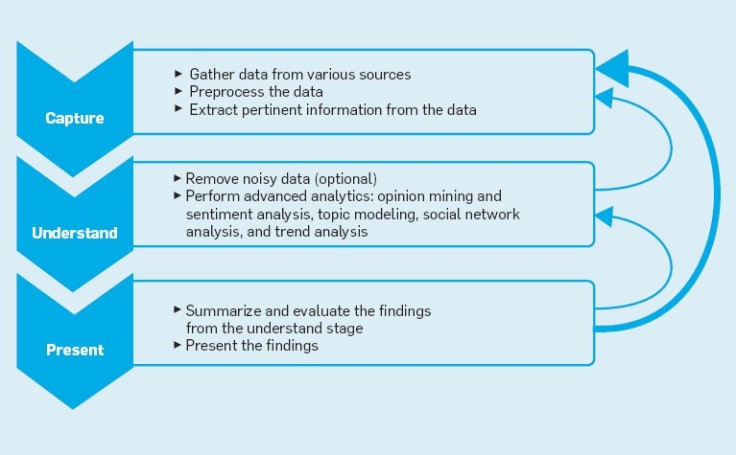
- Capture is the first step where an organization identifies conversation related to their brand, products, service, etc. on various social media platforms such as Twitter, Facebook, Pinterest, YouTube, and blogs. From the various platforms alone, a business can capture a huge amount of data. To move on to the next stage, different things need to be performed during this stage with the data such as linking data from various sources, creating some type of data model, tagging parts of conversations, extracting out specific highlights from the data, remove a lot of useless data to get a more meaningful analysis and perform other types of operations with the data that will support the analysis. Remember there are tools to help with pulling out keywords or mentions of a business, product, or services, etc. as mentioned in the previous blog “So Many Social Media Analytics Tools! Which Tool Is Best For You”.
- Once the data is capture and prepared, the next step is to try to Understand the data and get some metrics for making useful decisions. An example of metrics could be volume, how much people are talking about a brand, product, service, etc. Engagement is another metric to see how people are participating in the conversations about a brand, product, service, etc. The understand stage is the main part of the entire social media analytics process (Wan, Gordon 2014). This stage will provide information about user’s feelings. How the customer feel about a business and its products or service. This is where an understanding began to happen about the likelihood of a customer to purchase a product after seeing an ad campaign. Many useful metrics and trends about users can be formed during this stage. The results of understanding the data and metrics will have a major effect on the next step, present.
- The last step is Present. In this stage the results are summarized, evaluated and shown to users in a format they can understand. Visualization techniques such as a visual dashboard which can display aggregate information from various sources, different types of graphs, etc can help display information. There are definitely more sophisticated visual analytics such as real time visualizations. There are various tools to help with creating visualizations. This link can help get you started: http://www.kdnuggets.com/2015/06/top-30-social-network-analysis-visualization-tools.html
Some organizations may have their own business plan/process of developing their social media analytics. The three steps above are the basics and a guide to help get started so the entire process will not seem overwhelming.
Reference:
Wan, W., & Gordon, M. D. (2014, June). The Power of Social Media Analytics. Retrieved March 04, 2016, from http://cacm.acm.org/magazines/2014/6/175163-the-power-of-social-media-analytics/fulltext

March 23, 2016 at 6:40 pm
This is a very interesting topic. I believe that most of social media websites are turning these days into analytics for answers. Simply businesses want to know what customers are saying and respond to them; that makes social media data has a lot of sense. There is a really huge power of social media analytics to develop deeper understanding of target customers and that power appears when going through all the major steps that you just talked about here. Doing the analytics correctly would help you drive the business efficiently and eventually make a better profit. I think a business not only captures and identifies the products and services on social media web site, but also captures and focuses on real customer requirements to address customer needs and complaints.
LikeLike
March 28, 2016 at 7:31 pm
Wow very well put Omar! You are absolutely right. I think taking the right steps with using social media analytics is a great wait to help businesses get started with social media analytics and have an effective outcome.
LikeLike
March 24, 2016 at 11:24 pm
Interesting topic.. I like the way you explained this topic. Through the way u have explained social media analytic considering the steps taken to achieve this goal, it will be easy to grow one’s business, improve the company’s brand or product or service, and attract new customers. Nice work Kimberly !
LikeLike
March 28, 2016 at 7:32 pm
Thank you Olusola.
Yes, I very much think there should be some type of process of order to achieving the social media analytic goals and not just jumping in.
LikeLike
March 25, 2016 at 8:01 pm
HI,i realize now that there are much more insights to be gleaned from the social media, enough so that they are doing qualitative as well as quantitative analysis! I am especially curious about “sentiment” analysis and “opinion” mining. Very interesting post, Kimberly! Thanks!
LikeLike
March 28, 2016 at 7:34 pm
Thanks Pat.
Sentiment analysis which is also known as opinion mining, is a great study to understand and I’m curious to learn more about it as well. The contextual understanding and tone of what someone is saying can be hard to determine for businesses if it’s a negative (for example sarcastic) or positive statement. When I was looking into various social media analytic tools I came across a blog on the tool name Brandwatch Analytics and it discussed a little how they use Sentiment analysis.
One of the things the article state is “Teaching a machine to understand how context can affect tone is even more difficult.”
https://www.brandwatch.com/2015/01/understanding-sentiment-analysis/
LikeLike
March 27, 2016 at 1:43 am
Kimberly! Great post. Very clear and concise. Do you input inform of a count of how many people for example have shown engagement the social media website? What metrics do you use to measure?
~ Carol
LikeLike
March 28, 2016 at 7:36 pm
Thank you Carol.
From my understanding when it comes to engagement. Such as how many people were engaged, the number of individual people who have clicked, liked, commented on or shared a business’s posts during how every long of a time frame the business decides, ex. within a month, week, etc. can inform a count.
Some metrics I have seen in my research that should be measured are:
• Where is the business most traffic coming from?
• How many actual conversions are being discussed about a particular company, their brand, services, etc. on the various social media website?
• Measuring content quality. Is the information a business is sharing relevant?
The link below might can give you more insight as well.
http://sproutsocial.com/insights/social-media-metrics-that-matter/
LikeLike
May 4, 2016 at 1:42 am
I believe the most important of these three is understanding the data. From here the company can target its initiatives directly! Great post!
LikeLike